Last Updated: March 2026
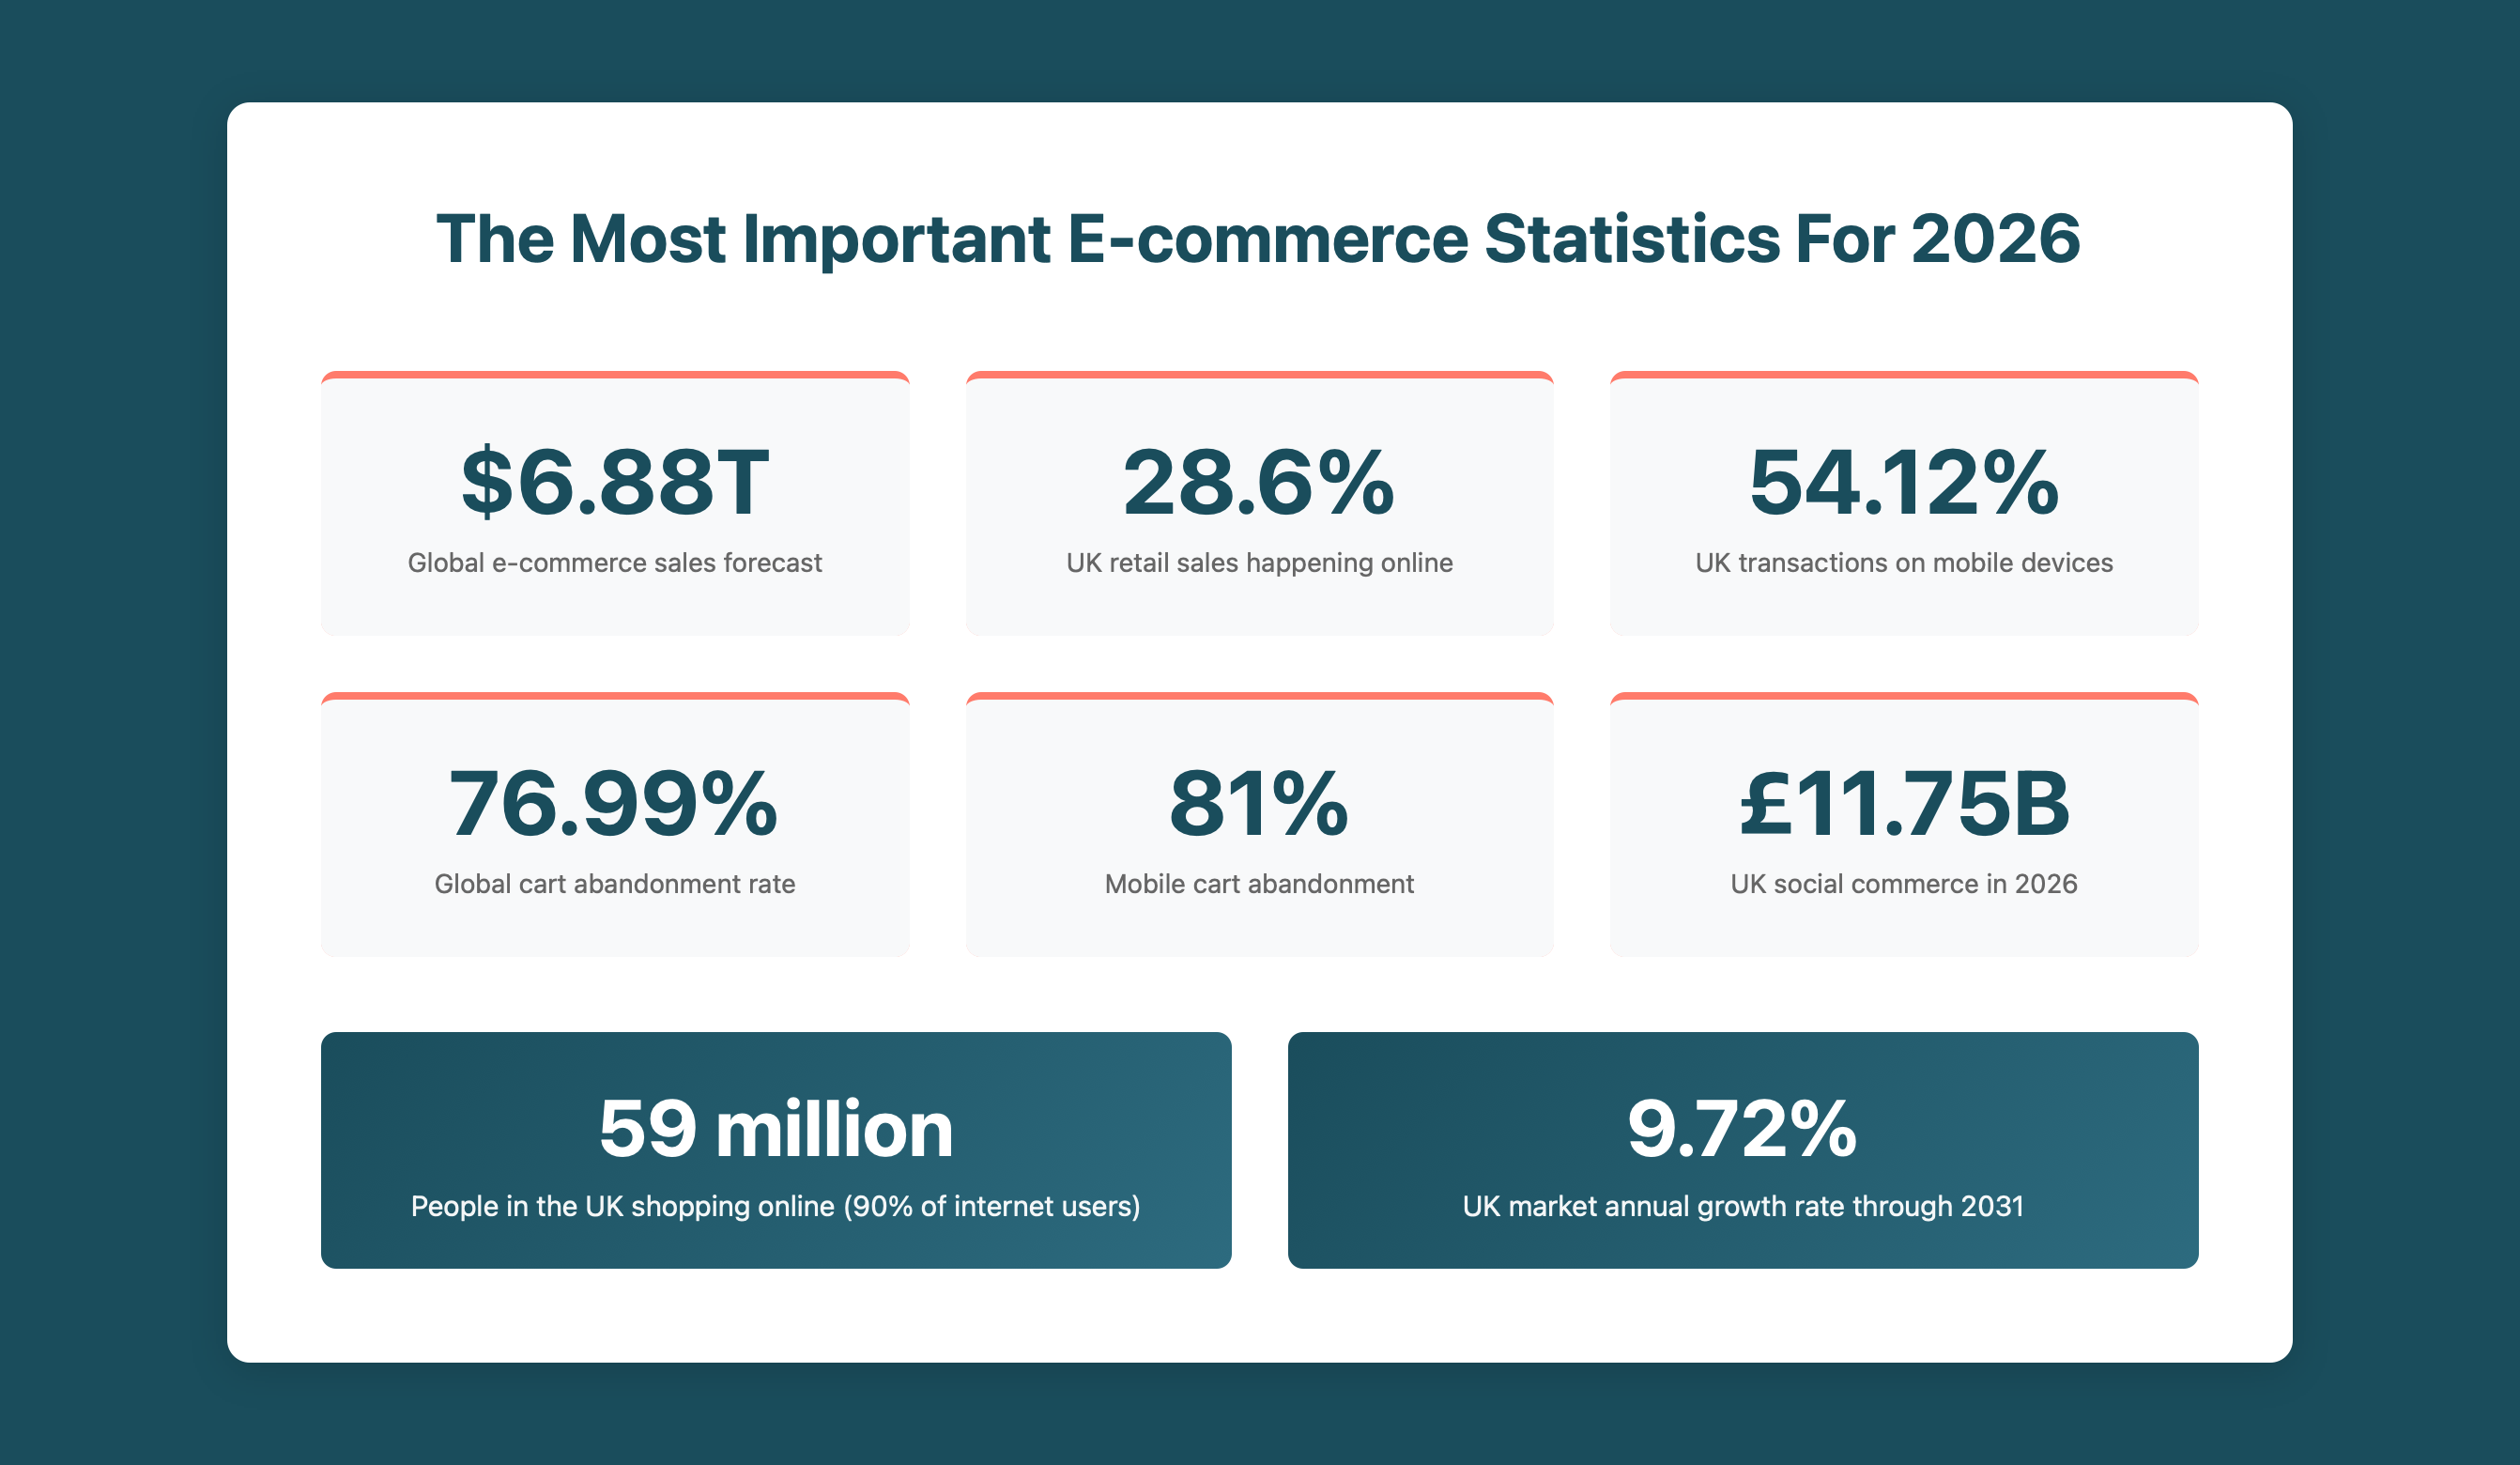
Global retail e-commerce reached $6.42 trillion in 2025 and is forecast to hit $6.88 trillion in 2026, accounting for 21.1% of all retail sales worldwide. In the UK, online sales now represent 28.6% of total retail, one of the highest digital penetration rates globally.
The growth story is no longer about acceleration. It is about optimisation.
In mature markets like the UK, where nearly one in three pounds is spent online, it is no longer enough to simply be online. It’s now about getting more from the customers you already have, making checkout easier and understanding what’s actually driving sales in your sector.
Whether you want to improve your conversion rate, get a clearer picture of mobile shopping trends or understand where your market is heading, these statistics give you a data-backed foundation for your 2026 planning.
For the broader marketing context, see our post on what’s working in marketing right now.
At a Glance: 2026 E-commerce Snapshot
| Metric | Figure | Source |
| Global e-commerce sales (2026 forecast) | $6.88 trillion | Shopify / eMarketer |
| UK e-commerce market (2026) | $317.33 billion | Mordor Intelligence |
| UK online share of retail (Nov 2025) | 28.6% | ONS |
| UK mobile transaction share | 54.12% | Mordor Intelligence |
| Global e-commerce share of retail (2026) | 21.1% | Shopify / eMarketer |
| Global cart abandonment rate (Jan 2026) | 76.99% | Dynamic Yield |
| Mobile cart abandonment (Jan 2026) | 81% | Dynamic Yield |
| Desktop cart abandonment (Jan 2026) | 68.59% | Dynamic Yield |
E-commerce Statistics: Key Takeaways
- Global e-commerce sales reached $6.42 trillion in 2025, forecast to grow to $6.88 trillion in 2026, a 7.2% year-on-year increase. (Shopify / eMarketer)
- E-commerce now accounts for 21.1% of total retail sales worldwide, up from 20.5% in 2025. (Shopify / eMarketer)
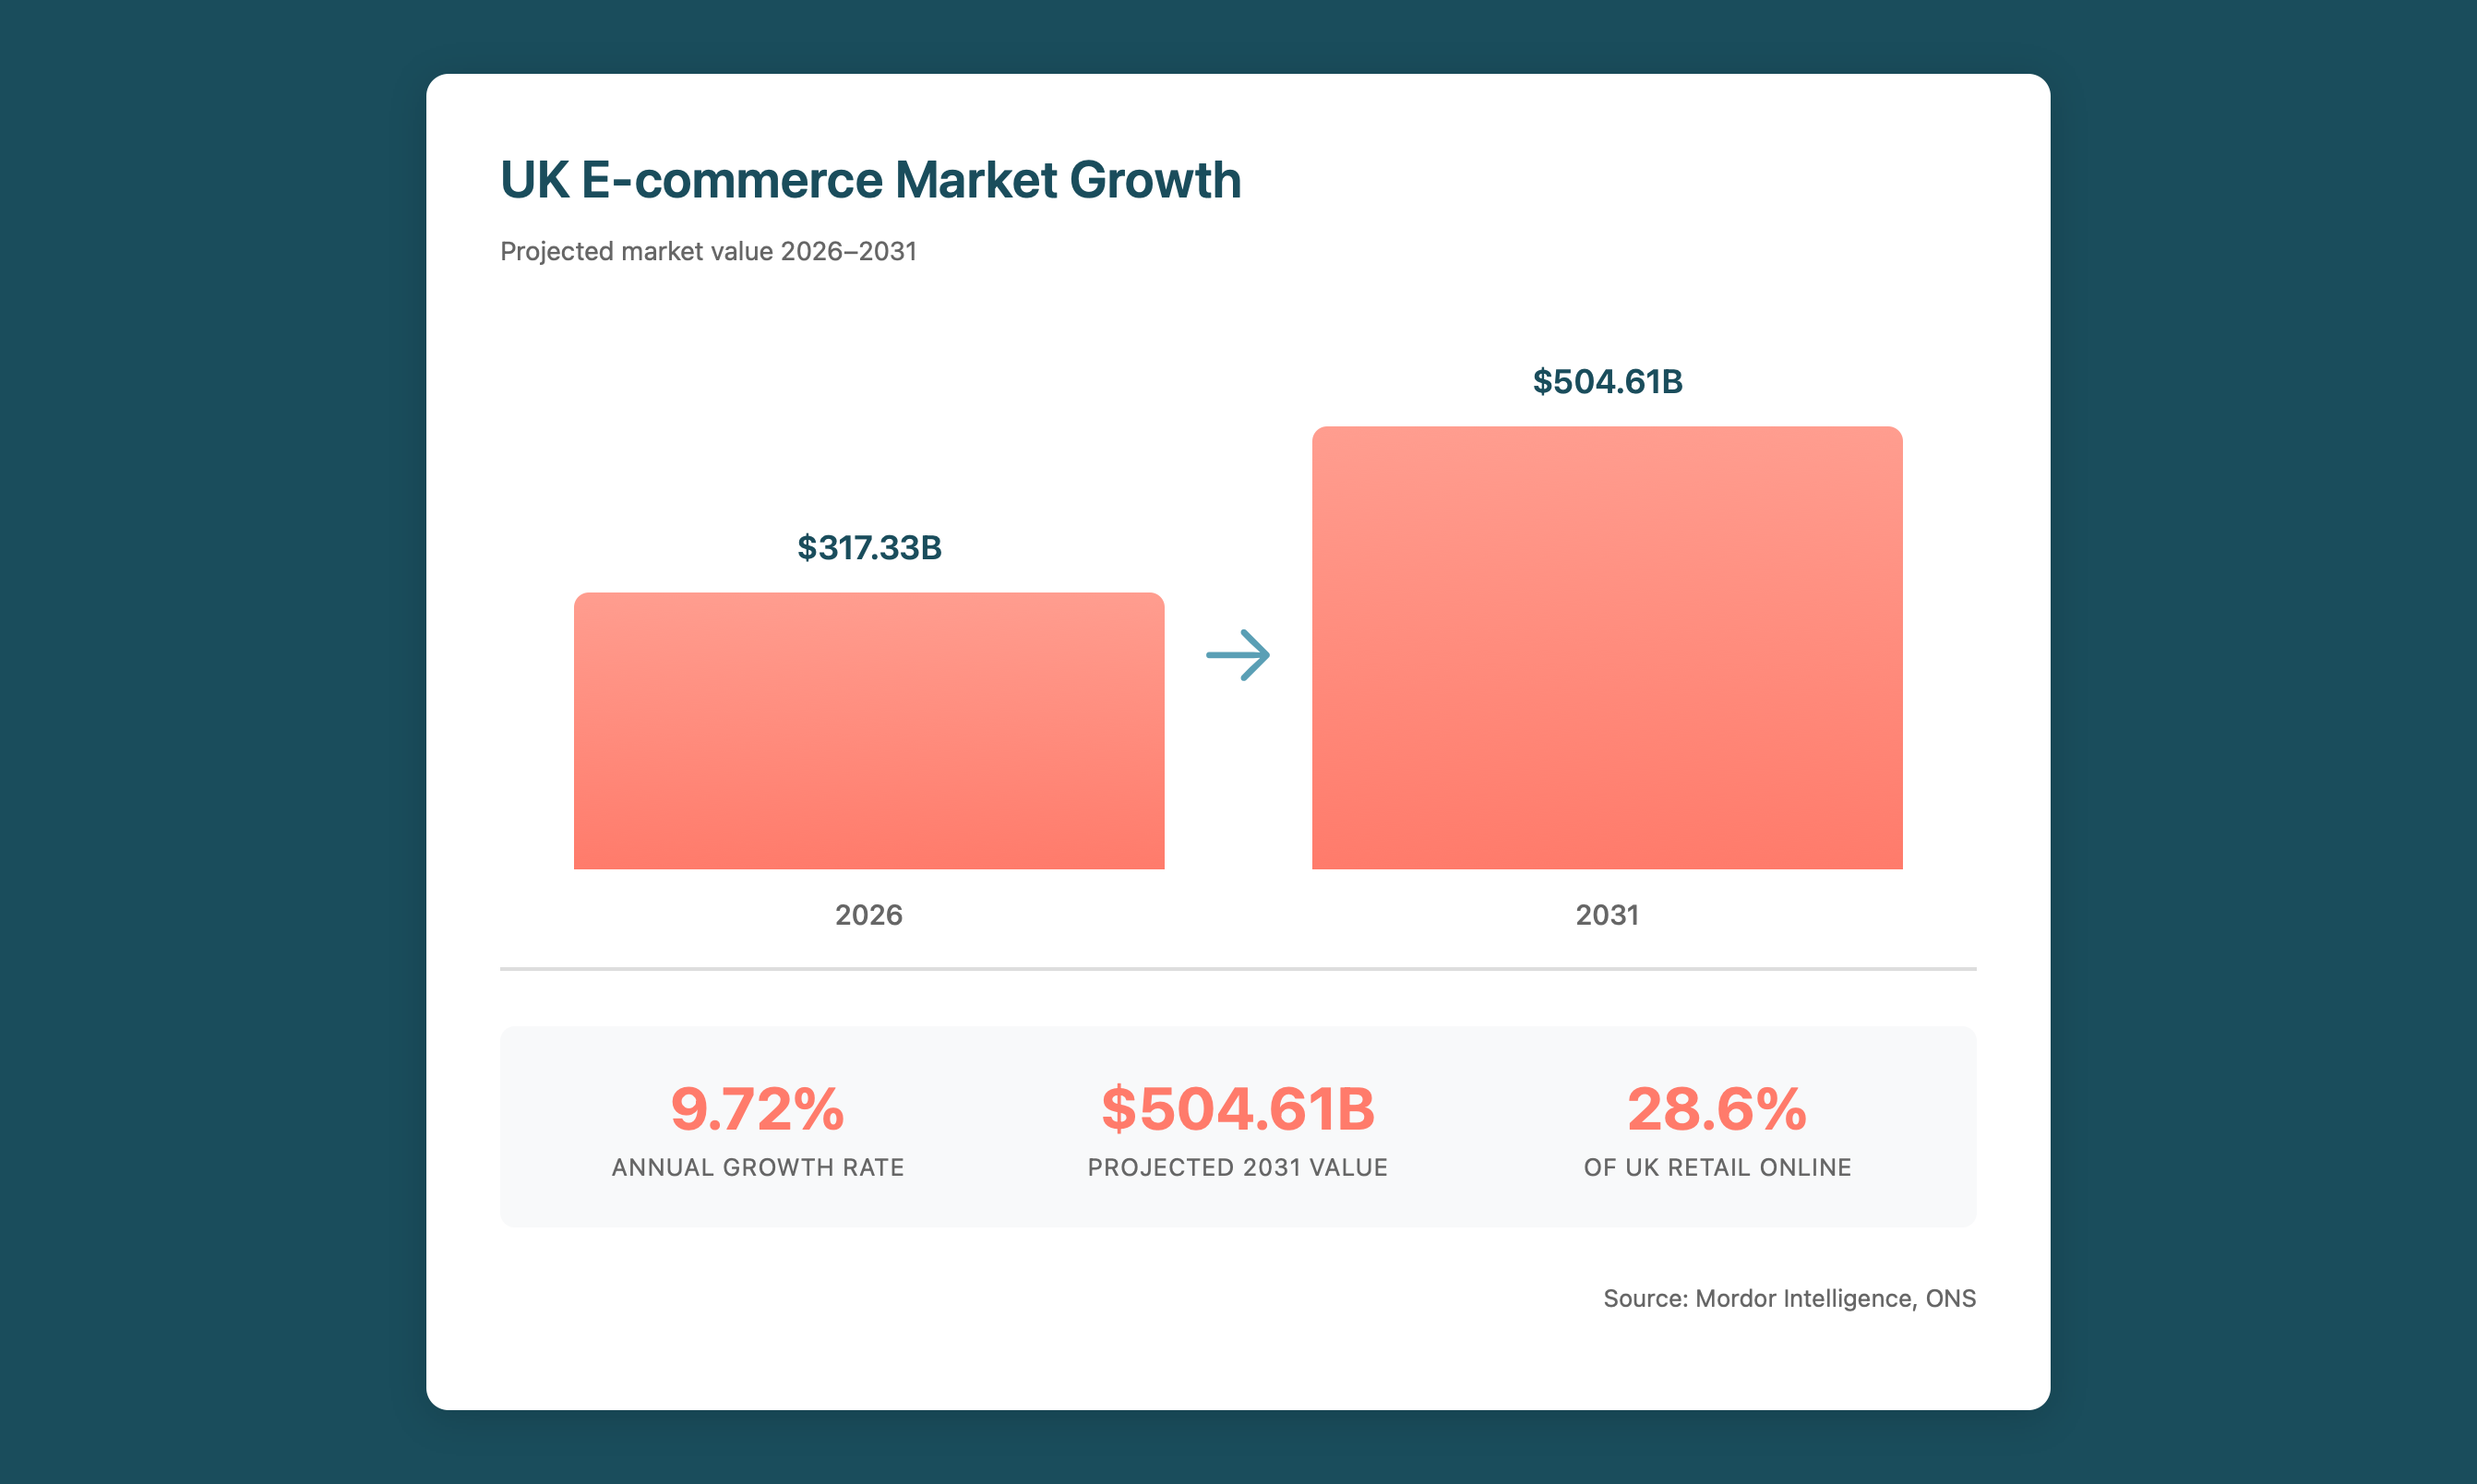
- The UK e-commerce market reached $317.33 billion in 2026, growing at 9.72% annually through 2031. (Mordor Intelligence)
- 28.6% of UK retail sales were online in November 2025, among the highest proportions recorded by the ONS. (ONS)
- Smartphones account for 54.12% of UK online transactions. (Mordor Intelligence)
- Fashion leads UK e-commerce at 29.17% of the B2C market; grocery is the fastest-growing category at 10.32% CAGR through 2031. (Mordor Intelligence)
- The global cart abandonment rate is 76.99%, with mobile reaching 81% in January 2026. (Dynamic Yield)
What does the 2026 data mean for UK e-commerce strategy?
Global growth has stabilised at around 7% annually, and the UK is already one of the most digitally mature retail markets in the world. With nine in ten UK internet users already shopping online, simply trying to reach more new customers is a diminishing return. The businesses growing most profitably are the ones making it easier to buy, keeping customers coming back and getting mobile right.
Global E-commerce Market Statistics
Global retail e-commerce sales reached $6.42 trillion in 2025. Forecasts point to $6.88 trillion in 2026 and $7.89 trillion by 2028. E-commerce’s share of total retail rose to 21.1% in 2026, up from 20.5% in 2025, steady expansion rather than explosive growth.
| Year | Global Sales | YoY Growth | % of Total Retail |
| 2025 | $6.42 trillion | 6.8% | 20.5% |
| 2026 | $6.88 trillion | 7.2% | 21.1% |
| 2028 | $7.89 trillion | 6.9% | 22.5% |
Source: Shopify citing eMarketer / Insider Intelligence
- Global e-commerce sales reached $6.42 trillion in 2025, forecast to grow to $6.88 trillion in 2026, representing 21.1% of total retail sales worldwide. (Shopify / eMarketer)
What does steady global growth mean for your strategy?
A 7% annual growth rate is healthy but no longer exceptional. The era of e-commerce expanding simply because more people were coming online is largely over in developed markets. What drives performance now is execution: a checkout that works, customers who come back and a clear sense of what your specific customers actually want.
UK Market E-commerce Statistics
The UK remains one of the world’s most digitally advanced e-commerce markets. With nearly 29% of retail happening online, most UK consumers are already buying online. The growth opportunity now lies in frequency, basket size and loyalty.
- The UK e-commerce market reached $317.33 billion in 2026, projected to grow to $504.61 billion by 2031 at a 9.72% compound annual growth rate. (Mordor Intelligence)
- Online sales comprised 28.6% of total UK retail in November 2025, among the highest proportions recorded by the ONS. (ONS)
- The UK has 59 million people shopping online, representing over 90% of UK internet users, one of the highest adoption rates globally. (Landmark Global)
- British consumers spend an average of €3,013 online per year. (Landmark Global)
- Fashion leads the UK B2C market at 29.17%, while grocery is the fastest-growing category at 10.32% CAGR through 2031. (Mordor Intelligence)
- B2B e-commerce is growing at 12.47% CAGR, faster than B2C, as businesses accelerate digital procurement. (Mordor Intelligence)
- 70% of UK online shoppers insist on clear delivery charges before checkout, and 59% say a simple, reliable returns process is essential to their purchase decision. (Landmark Global)
What does the UK market data tell us?
With 90% of UK internet users already shopping online, finding brand-new customers is getting harder and more expensive. In a market this mature, the biggest gains tend to come from keeping the customers you already have, not just finding new ones. The data is consistent on what gets in the way: unexpected delivery costs, complicated returns or a checkout that does not work properly on mobile. None of these are difficult to fix, they just need to be treated as a priority.
Mobile Shopping Statistics
Mobile commerce has crossed the majority threshold in the UK. With 54.12% of online transactions now happening on mobile, and cart abandonment rates significantly higher on mobile than desktop, this is where conversion battles are won and lost.
- Smartphones account for 54.12% of UK B2C online transactions, with mobile now the default device for e-commerce. (Mordor Intelligence)
- Mobile devices accounted for 57% of global e-commerce sales in 2024, up from just 19% in 2014, a near-trebling in a decade. (Red Stag Fulfillment, citing Worldpay / Statista)
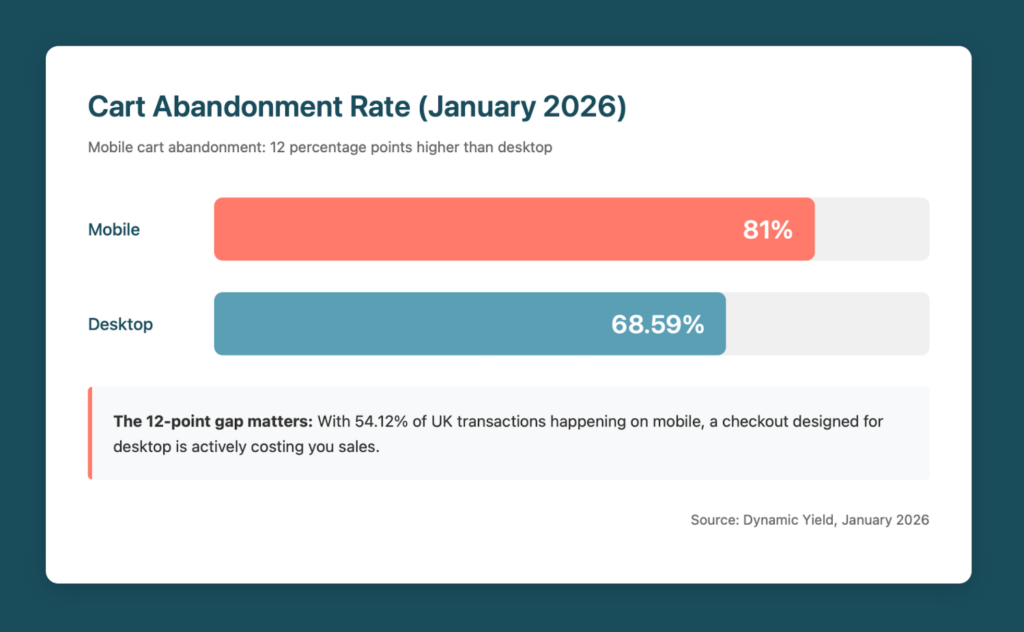
- Mobile cart abandonment averaged 81% in January 2026, compared to 68.59% for desktop, a gap of over 12 percentage points. (Dynamic Yield, captured January 2026)
- Nearly 80% of consumers worldwide visit a retailer’s website on their smartphone while shopping in a physical store, blurring the line between online and offline retail. (eMarketer)
- 81% of Gen Z use their phone as their primary shopping device. (HubSpot)
- Brands using SMS marketing saw a 20% year-on-year increase in e-commerce revenue over Black Friday/Cyber Monday 2024 compared to those that did not. (Klaviyo)
What are the most important things to address in mobile e-commerce right now?
The 12-point gap between mobile and desktop abandonment tells you where the problem is. With more than half of UK transactions now happening on smartphones, a checkout that was built around a desktop screen is actively costing you sales. The fixes are well known: fewer steps, delivery costs shown upfront, digital wallets as the default payment option and pages that load in under two seconds.
Social Commerce and Discovery Statistics
Social commerce is reshaping how customers discover and purchase products. Established platforms like Instagram, TikTok and Facebook are becoming direct purchase channels, while communities like Reddit function as research and validation tools.
- UK social commerce sales will reach £11.75 billion in 2026, with double-digit growth forecast through 2029. (eMarketer, December 2025)
- In 2024, there were over 200,000 active businesses on TikTok Shop in the UK, with more than 5,000 live shopping sessions every day and daily sales up 93% year-on-year. (ChannelX)
- 61% of TikTok users have made a purchase directly on TikTok or after seeing a TikTok ad. (ChannelX)
- TikTok Shop generated $33.2 billion in global sales in 2024, establishing it as a significant commerce platform in its own right. (Shopify)
- 1 in 4 social media users, rising to 43% of Gen Z, bought a product directly through a social media app in the past three months. (HubSpot)
- 29% of consumers discovered a new product through a social media influencer. (HubSpot)
Separately, platforms like Reddit now function as much as a search tool as a social platform, with Google surfacing forum discussions in both traditional search results and AI Overviews. Customers increasingly seek authentic peer recommendations before visiting brand sites. See our post on why Reddit’s surge past TikTok matters for e-commerce brands.
How should social commerce change your approach?
Social media and online shopping are increasingly the same thing. Platforms that people originally used to follow friends and brands are now places where they discover products, read reviews and complete purchases without ever visiting a website. For businesses, this means your presence on social platforms is a direct sales channel, not just a way to build awareness. Product content, customer reviews, creator partnerships and live shopping are all part of how people buy now. If those things are sitting in a separate strategy document from your e-commerce plan, you’re likely leaving money on the table in a UK social commerce market worth £11.75 billion.
Statistics on Customer Behaviour and Trends
- 64% of consumers want personalised experiences, but only 41% feel the privacy trade-off is worth it and just 39% believe organisations actually use their personal data responsibly. (Qualtrics 2026)
- 53% of consumers worry that AI-enabled customer support poses privacy risks. (Qualtrics 2026)
- 55% of consumers are tightening budgets due to economic conditions, with reduced spend on discretionary categories. (HubSpot)
- 91% of businesses now use video as a marketing tool, and 85% of people report being convinced to buy a product after watching a video about it. (Wyzowl 2026)
- 84% of consumers want to see more video content from the brands they buy from. (Wyzowl 2026)
- 73% of B2B buyers prefer to place orders online, yet 85% report frustrations with the online ordering experience and 75% say they would switch supplier for a better one. (Sana Commerce 2025)
What do customer behaviour trends mean for e-commerce businesses in 2026?
Customers are more careful with their money, more likely to research before they buy and more sceptical of how brands use their data than ever before. Clever marketing can help, but it won’t close that gap on its own. What actually builds trust is straightforward: show prices clearly, make returns easy, use video to show products honestly and respond to customer service issues properly. The B2B figures are particularly striking: three quarters of business buyers say they would switch supplier simply for a better online experience, which suggests the bar in many B2B sectors is still surprisingly low.
E-commerce Conversion and Cart Abandonment Statistics
- The global average cart abandonment rate was 76.99% in January 2026. (Dynamic Yield, live benchmark)
- Mobile cart abandonment averaged 81% in January 2026, over 12 percentage points higher than desktop at 68.59%. (Dynamic Yield, captured January 2026)
- The top reason customers abandon carts is unexpected extra costs, primarily shipping fees, taxes and surcharges added at checkout. (Baymard Institute)
- Better checkout design alone can increase conversion rates by 35.26%, representing an estimated $260 billion in recoverable revenue annually for US and European retailers. (Baymard Institute)
- The average e-commerce conversion rate sits between 2–4%, with significant variation by category, device and traffic source. (Smart Insights)
- Cart abandonment emails achieve an average open rate of 39.07%, a click-through rate of 23.33% and a conversion rate of 10.7%. (Hotjar)
- 57% of shoppers will abandon a site that takes more than three seconds to load. (Hotjar)
- 40% of shoppers who abandon a cart switch directly to a competitor. (Hotjar)
What do we need to know about cart abandonment and conversion?
A 76.99% abandonment rate sounds alarming, but it helps to put it in context: most people who add something to a cart were browsing, not ready to buy. The more useful question is how much of that abandonment is caused by friction you can remove. Unexpected costs at checkout are the single biggest reason people walk away, and it is a problem entirely within your control. Show delivery costs before checkout, remove the requirement to create an account and keep the journey as short as possible. And if someone does leave, a well-timed follow-up email is one of the most straightforward revenue recovery tools available, converting at 10.7% on average.
Digital Payments Statistics
- Digital wallets captured 53% of global online purchases in 2024, more than double the 20% captured by credit cards, and are forecast to reach 65% of global e-commerce transactions and 45% of all in-store payments by 2030. (Capital One Shopping, January 2026)
- There are 4.5 billion digital wallet users globally in 2025, growing to 5.2 billion in 2026, over half the world’s population. (Capital One Shopping, January 2026)
- In the UK, Apple Pay led 2024 mobile payments, accounting for 63% of digital wallet users. (Capital One Shopping, January 2026)
- 50% of consumers factor checkout ease into their decision about where to shop online, meaning payment friction directly impacts retailer choice. (eMarketer)
- Buy Now Pay Later purchase volume reached $122.3 billion in 2025, up 10.9% year-on-year, as flexible payment options move further into the mainstream. (Capital One Shopping, January 2026)
- 46.2 million Gen Z consumers are expected to have adopted digital payment methods by 2027, as the generation enters its peak earning years. (eMarketer)
What payment methods will customers expect in 2026?
Digital wallets have overtaken cards as the most common way people pay online globally, and in the UK Apple Pay alone accounts for 63% of digital wallet usage. Half of shoppers say checkout ease influences where they choose to shop, which means not offering the payment methods your customers already use is a real barrier to sale. BNPL is growing steadily too, particularly as a way for customers to spread the cost of larger purchases. The takeaway is simple: offer the options your customers expect and make them easy to find.
E-commerce Platform Statistics
- WooCommerce and WooCommerce-based platforms collectively account for 55.13% of global e-commerce store count, making it the most widely deployed platform by volume. (Datanyze)
- Amazon.com is the most visited e-commerce website in the world, with multiple Amazon domains occupying the global top-10 rankings as of January 2026. (Similarweb)
How much does platform choice actually matter?
WooCommerce leads on raw store count but the best platform for your business depends on your size, your team and what you are selling. More important than which platform you choose is how well it is set up for speed, for mobile shoppers and for making it as easy as possible to complete a purchase. We have seen strong and poor results on all of the main platforms; the technology is rarely what holds a business back.
AI and E-commerce in 2026
Artificial intelligence has moved from experimentation to operational infrastructure across e-commerce. From personalised product recommendations to automated customer service and predictive inventory management, AI is reshaping how retailers operate and how customers shop.
- 51% of e-commerce businesses are already using AI to create smoother, more personalised shopping experiences. (Shopify)
- 84% of e-commerce businesses rank AI as their highest priority right now, reflecting its shift from competitive advantage to operational necessity. (Shopify)
How is AI changing e-commerce in practice?
The headline figures are striking, but what matters more is where AI is actually making a difference. Better product recommendations, smarter inventory management, faster customer service and more relevant email marketing are the areas where businesses are seeing real results. For most UK e-commerce businesses, the best starting point is not building something bespoke, it is using the AI features already built into the tools you are paying for, and making sure they are properly configured.
E-commerce Statistics by Industry
Fashion
Fashion is the largest UK e-commerce category and one of the most mobile- and social-driven verticals globally.
- Fashion accounts for 29.17% of the UK B2C e-commerce market, the largest single category. (Mordor Intelligence)
- The secondhand and resale market is forecast to grow up to three times faster than the firsthand fashion market through 2027. (McKinsey State of Fashion 2026)
- Jewellery is forecast to be the fastest-growing fashion category by unit sales, growing at more than four times the rate of clothing. (McKinsey State of Fashion 2026)
- Over 35% of fashion executives are already using generative AI in customer service, image creation, copywriting and product discovery. (McKinsey State of Fashion 2026)
What does the fashion data tell us?
Fashion is bought on mobile, discovered on social media and increasingly influenced by values around sustainability and second-hand ownership. The resale market growing at three times the rate of new fashion is not a niche trend, it reflects a genuine shift in how younger shoppers think about what they buy and where they buy it. Brands that engage with that shift, whether through resale programmes, repair services or simply being honest about how products are made, are better placed than those that ignore it.
Beauty and Personal Care
- The global beauty and personal care e-commerce market is worth $138.91 billion in 2026, growing at 6.4% CAGR to reach $189.36 billion by 2031. (Mordor Intelligence)
- Skin care dominates with 41.52% of beauty e-commerce revenue in 2025, driven by AR diagnostic tools and ingredient transparency. (Mordor Intelligence)
- Hair care shows the highest subcategory growth rate at 7.10% CAGR through 2031. (Mordor Intelligence)
- The mass beauty segment holds 71.36% market share, while premium is growing faster at 7.52% CAGR, driven by technology and influencer partnerships. (Mordor Intelligence)
What is driving beauty e-commerce growth?
Beauty is one of the clearest examples of a category where what people see on social media directly leads to what they buy. Instagram and TikTok go beyond ads. They’re where people pick trusted products based on what real customers and creators say, rather than what brands claim. Businesses that invest in genuine creator partnerships and encourage customer content consistently outperform those still relying primarily on polished brand photography.
Food and Grocery
- Grocery is the fastest-growing UK e-commerce category at 10.32% CAGR through 2031, driven by convenience, rapid delivery infrastructure and subscription models. (Mordor Intelligence)
- The global subscription economy reached $560 billion in 2025, growing at 13% CAGR, with meal kits, speciality food and subscribe-and-save options building stable repeat revenue across food e-commerce. (Shopify)
- TikTok Shop generated $33.2 billion in global sales in 2024, with food and beverage among its fastest-growing categories. (Shopify)
What is shaping food and grocery e-commerce?
Grocery’s growth online is not a passing phase, convenience has become a permanent part of how people shop for food. Subscription models work particularly well in this category because they turn a one-off purchase into a regular one, creating predictable revenue that is hard for competitors to disrupt. For food brands with a strong story or a distinctive product, TikTok Shop is also opening up audiences that traditional retail would never have reached.
Consumer Electronics
- Global consumer electronics e-commerce grew from $736.49 billion in 2025 to $789.81 billion in 2026 and is projected to expand at 7.52% CAGR to reach $1.22 trillion by 2032. (ResearchAndMarkets)
What does the electronics data tell us?
Electronics shoppers do their homework. They compare products across multiple sites, read reviews carefully and check return policies before committing. In this category, the quality of your product information and the clarity of your returns policy matter far more than a promotional discount. Customers who are ready to buy will buy, what puts them off is uncertainty, not price.
Evergreen E-commerce Benchmarks
Some fundamentals remain consistent year on year. These form the baseline for any e-commerce strategy, regardless of category or market:
- Global cart abandonment rate: 76.99% (Dynamic Yield, January 2026)
- Average e-commerce conversion rate: 2–4% (Smart Insights)
- 91% of businesses use video as a marketing tool (Wyzowl 2026)
- 85% of people have been convinced to buy a product after watching a video about it (Wyzowl 2026)
- Top cart abandonment reason: unexpected extra costs, particularly shipping fees (Baymard Institute)
- Better checkout design can increase conversion rates by 35.26% (Baymard Institute)
- Cart abandonment email conversion rate: 10.7% (Hotjar)
Why do the fundamentals still matter?
Platforms change, algorithms shift and new channels appear every year. The factors that determine whether a visit becomes a sale have not changed, and they are unlikely to: being upfront about costs, making checkout simple, ensuring fast loading times and giving customers reasons to trust you.
What High-Performing UK E-commerce Brands Are Doing Differently in 2026
Based on our work with UK e-commerce businesses across fashion, retail and consumer categories, we see five clear patterns that separate high-performers from the rest.
1. They optimise for margin, not just revenue
- Reducing paid dependency
- Increasing returning customer revenue
- Prioritising average order value and lifetime value over raw traffic growth
They understand growth has normalised. Efficiency wins.
2. They treat mobile as primary, not responsive
- Checkout-first mobile flows
- Thumb-zone UX
- One-tap payment prioritisation
- Compressed page speed under 2 seconds
3. They actively manage abandonment
Rather than accepting 76.99% abandonment as industry standard, they:
- Remove forced account creation
- Optimise delivery messaging
- Surface trust signals earlier
- A/B test checkout fields quarterly
4. They invest in owned channels
With acquisition costs rising, leaders:
- Build email flows beyond basic welcome sequences
- Invest in SMS where appropriate
- Improve post-purchase communication
- Increase repeat purchase frequency
5. They differentiate by sector
They do not apply the same approach regardless of what they sell:
- Fashion: social and mobile heavy
- Grocery: subscription and speed
- Electronics: trust and comparison content
- Beauty: customer content and community
What the 2026 Data Tells Us
E-commerce is here to stay, and the data for 2026 paints a clear picture of where the market is heading. Global sales are on course for $6.88 trillion. In the UK, nearly three in ten pounds of retail spend is already online. Mobile phones dominate shopping, social commerce enables direct in-app buys, and AI has become a business essential.
What the data also tells us is that the gap is widening between businesses doing the basics well and those that are not. Clear pricing, a checkout that works on mobile, well-timed follow-up emails and content that actually helps customers make a decision: none of these are new ideas, but they are making all the difference for most UK retailers right now.
If you’re looking at this data and wondering where to start, the answer is usually to focus on three things: cut checkout friction, understand what’s really driving sales in your market, and serve existing customers as well as new ones.
Our team works with UK e-commerce businesses on exactly these challenges, from website design and development to SEO, paid media and conversion rate optimisation. If you’d like to talk through what the numbers mean for your business, we’re happy to help.
Get in touch at [email protected] or call +44 (0)115 778 6950.
Sources
- ONS UK Retail Sales, November 2025
- Shopify / eMarketer – Global E-commerce Sales
- Mordor Intelligence – UK E-commerce Market
- Mordor Intelligence – Beauty and Personal Care E-commerce
- Baymard Institute – Cart Abandonment Rate
- Dynamic Yield – Cart Abandonment Benchmarks
- ResearchAndMarkets – Consumer Electronics E-commerce
- McKinsey and Company – State of Fashion 2026
- Landmark Global – UK E-commerce 2025
- eMarketer – UK Social Commerce 2026
- eMarketer – Mobile Commerce Guide
- Capital One Shopping – Digital Wallet Statistics 2026
- Capital One Shopping – BNPL Statistics 2026
- ChannelX – TikTok Shop UK 2024 in Numbers
- Shopify – Food and Beverage Industry Trends
- Shopify – AI Statistics
- Qualtrics – Global Consumer Experience Trends 2026
- HubSpot – State of Consumer Trends 2025
- Sana Commerce – B2B Buyer Report 2025
- Wyzowl – Video Marketing Statistics 2026
- Hotjar – Cart Abandonment Statistics
- Smart Insights – E-commerce Conversion Rate Benchmarks
- Klaviyo – BFCM 2024 Winning Strategies
- Red Stag Fulfillment – Mobile Commerce Statistics
- Datanyze – E-commerce Platform Market Share
- Similarweb – Top E-commerce Websites


